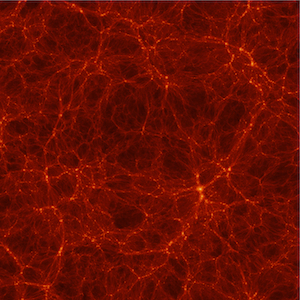
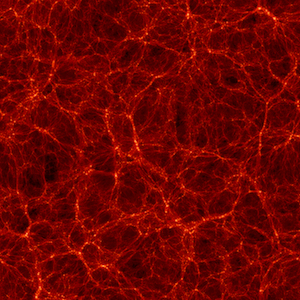
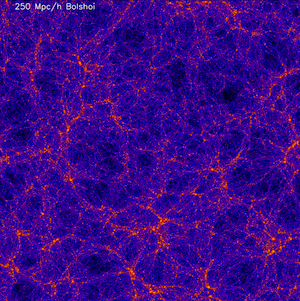
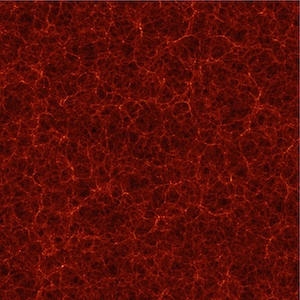
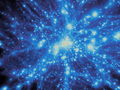
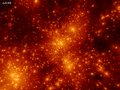
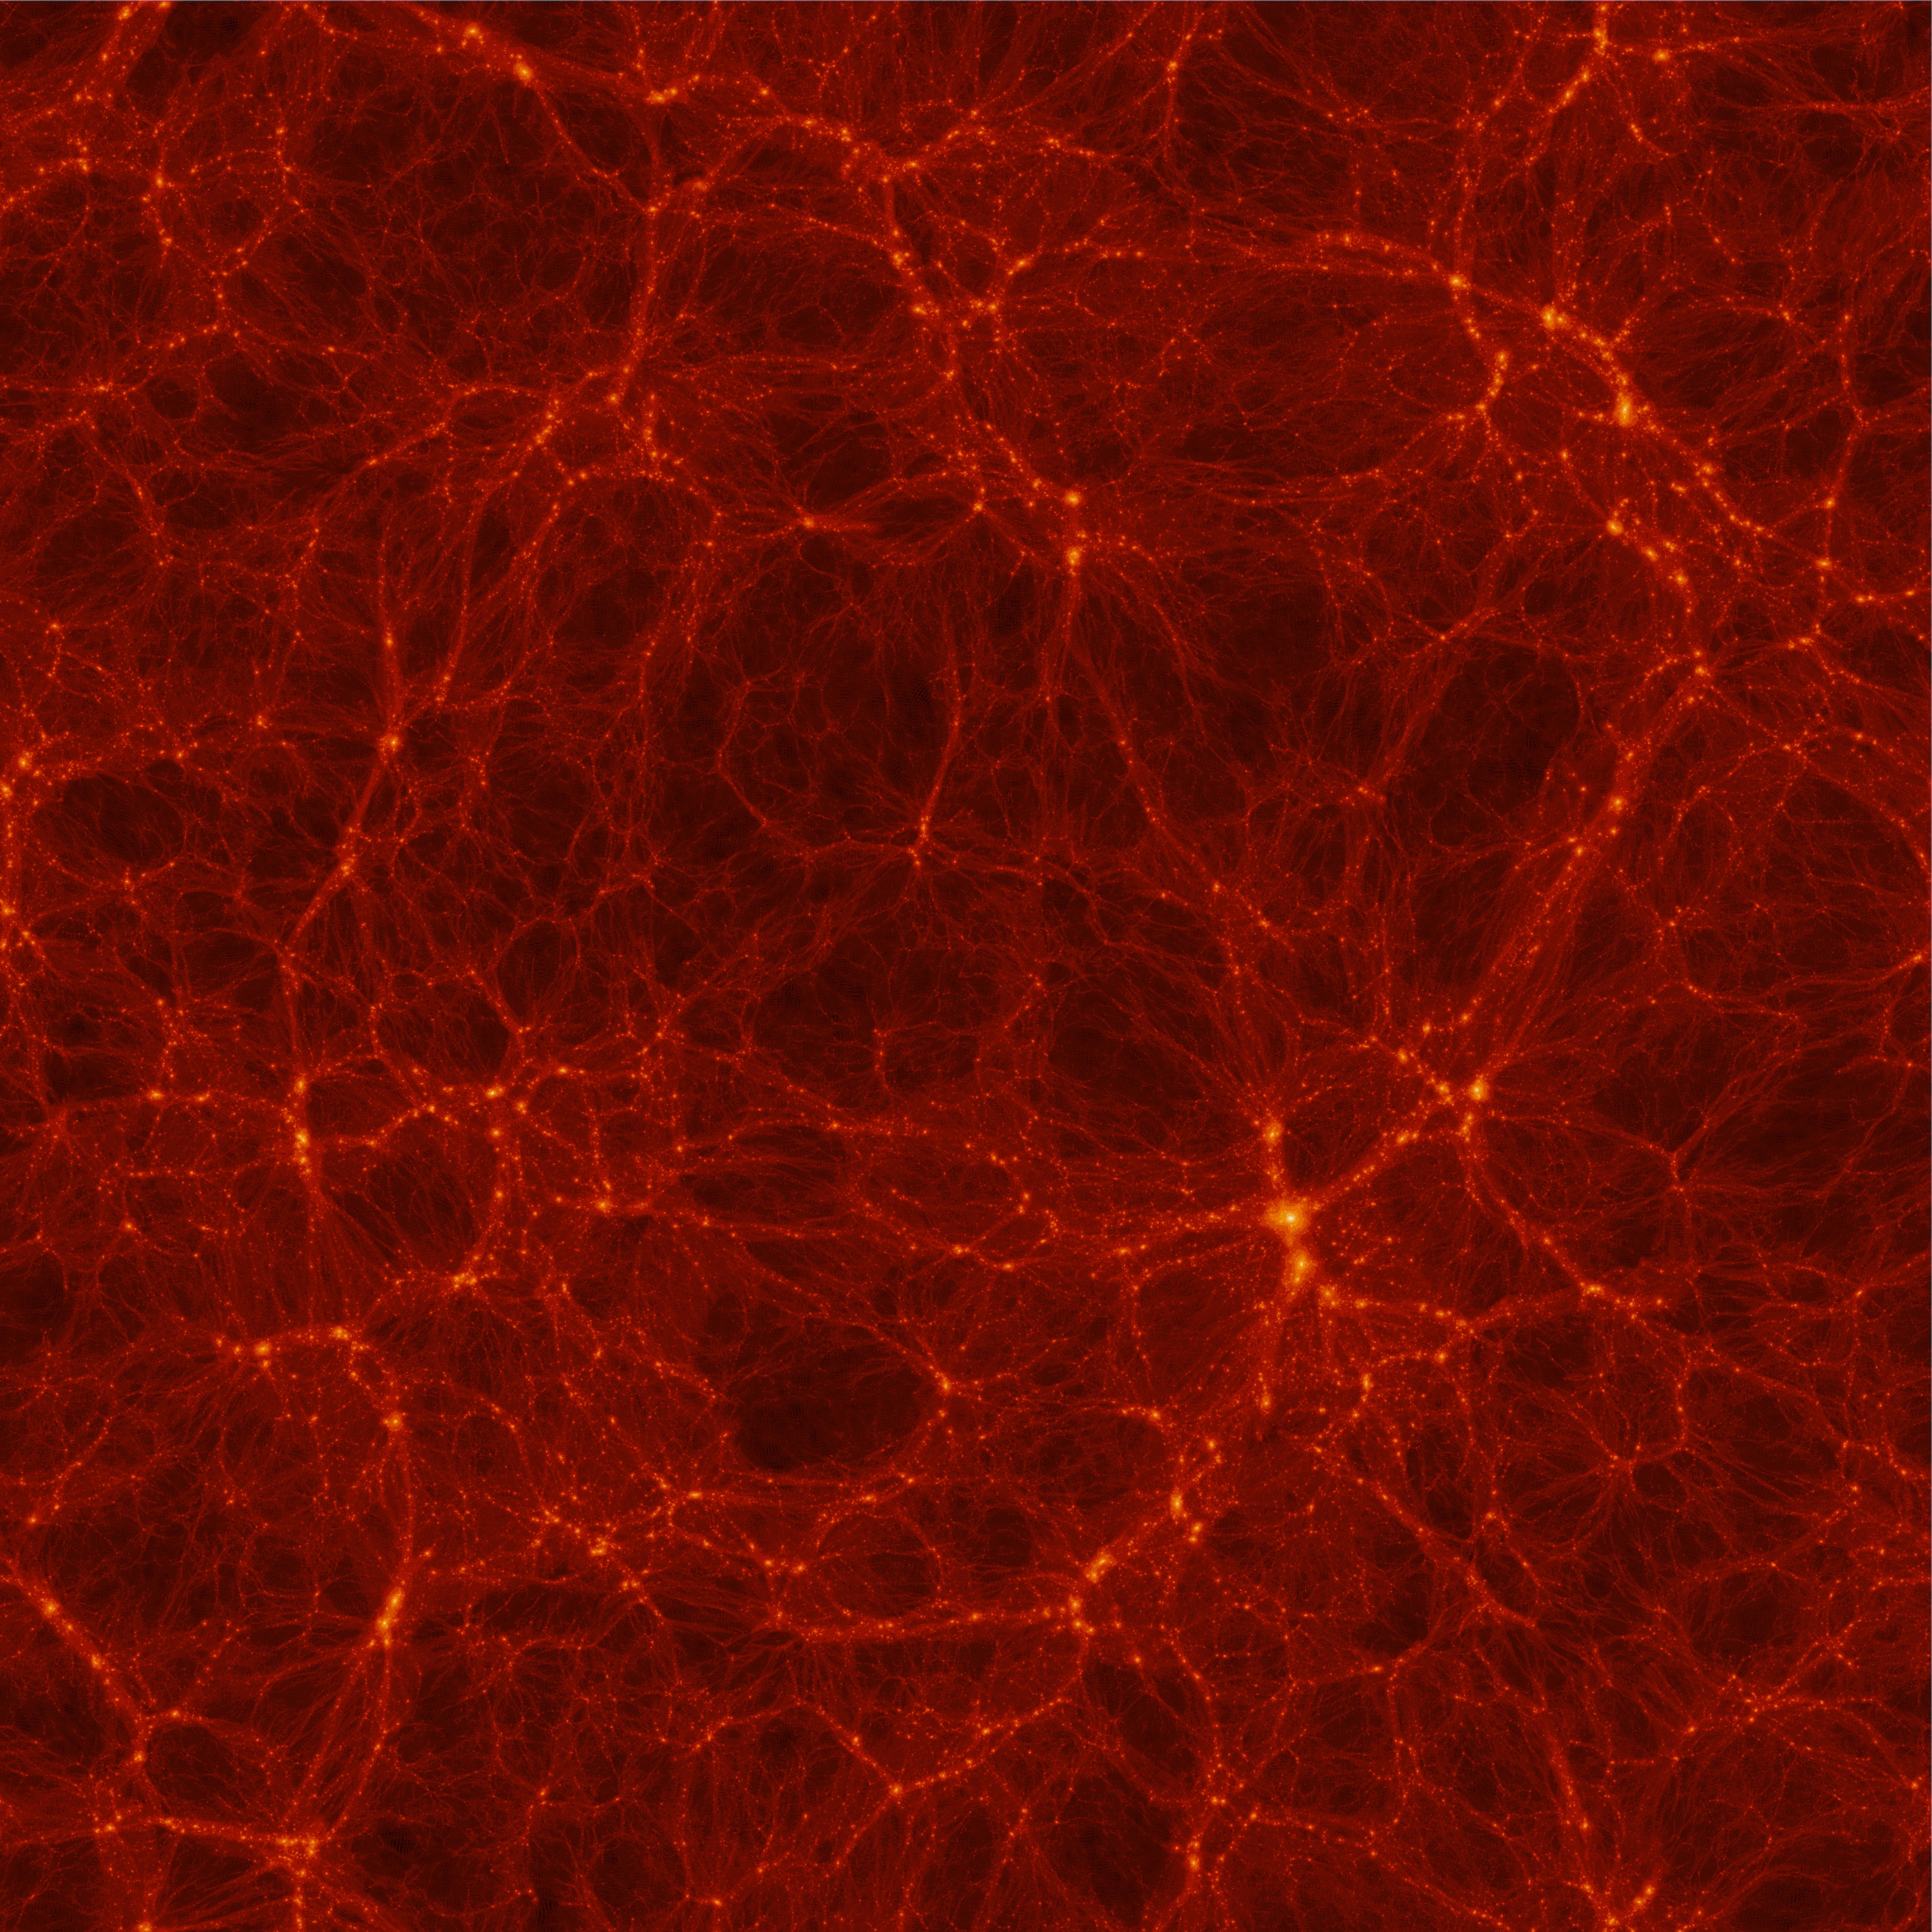
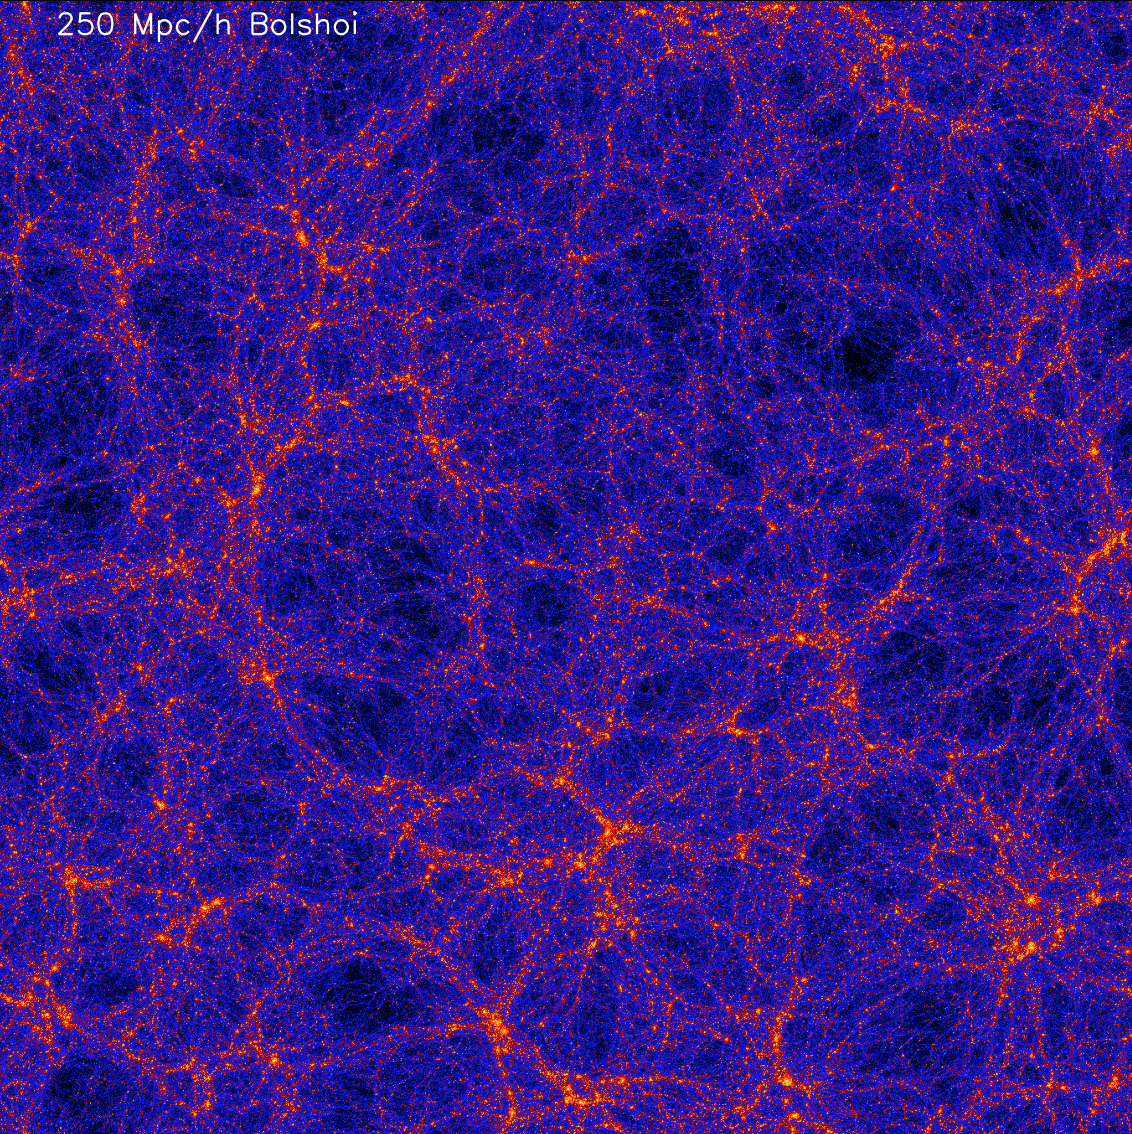
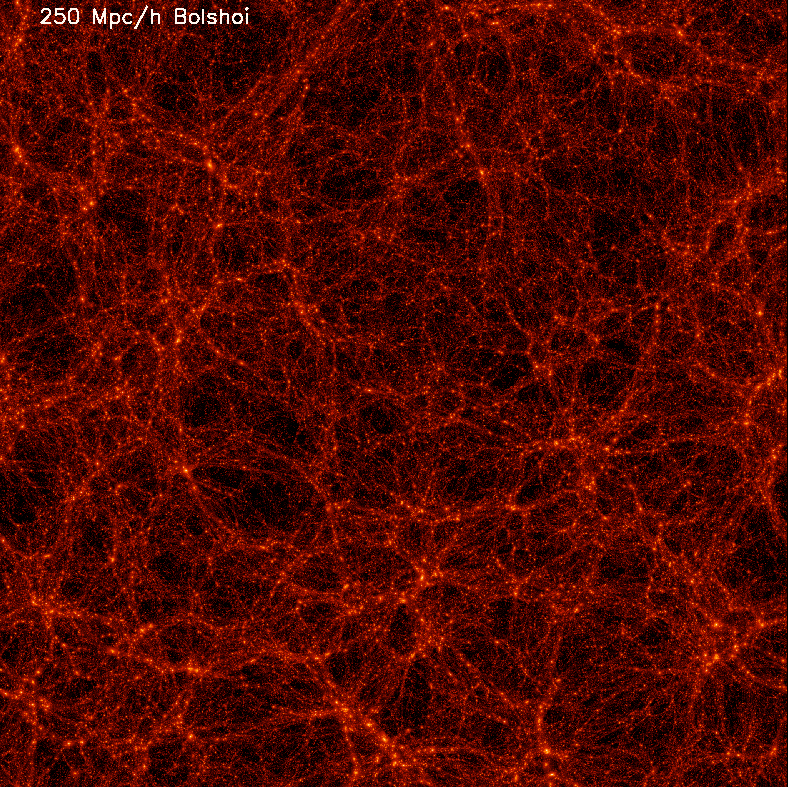
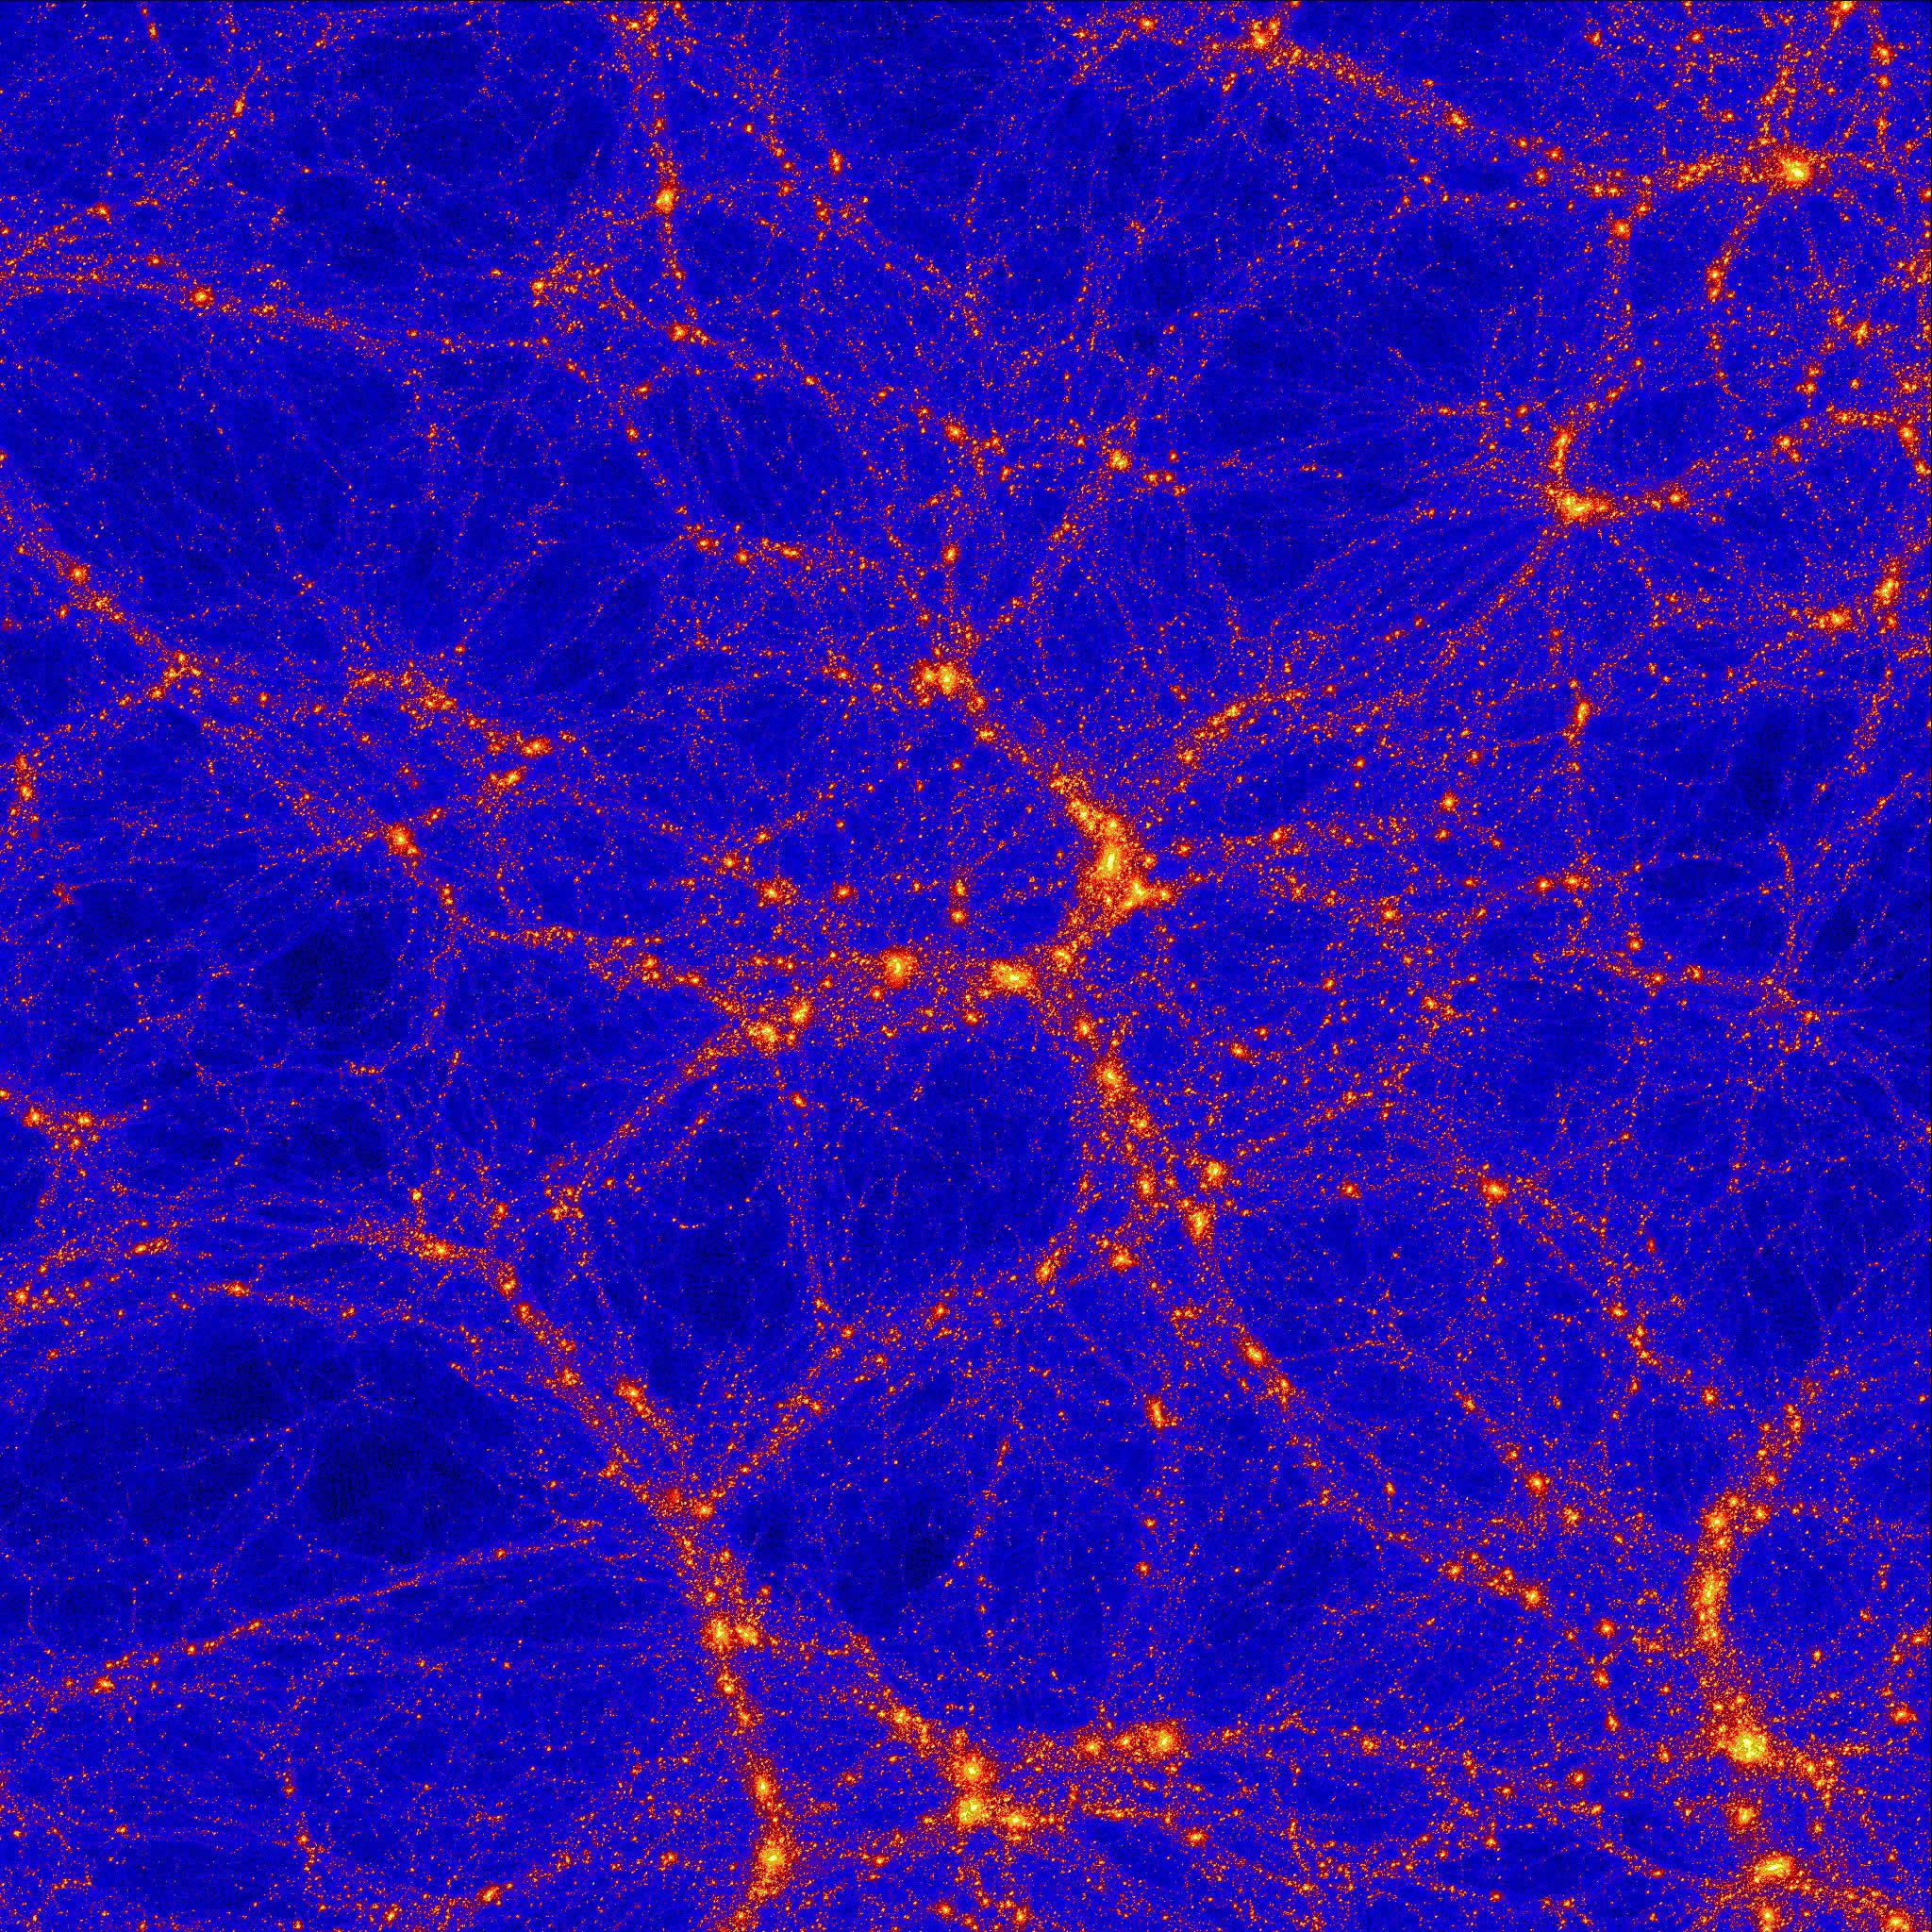
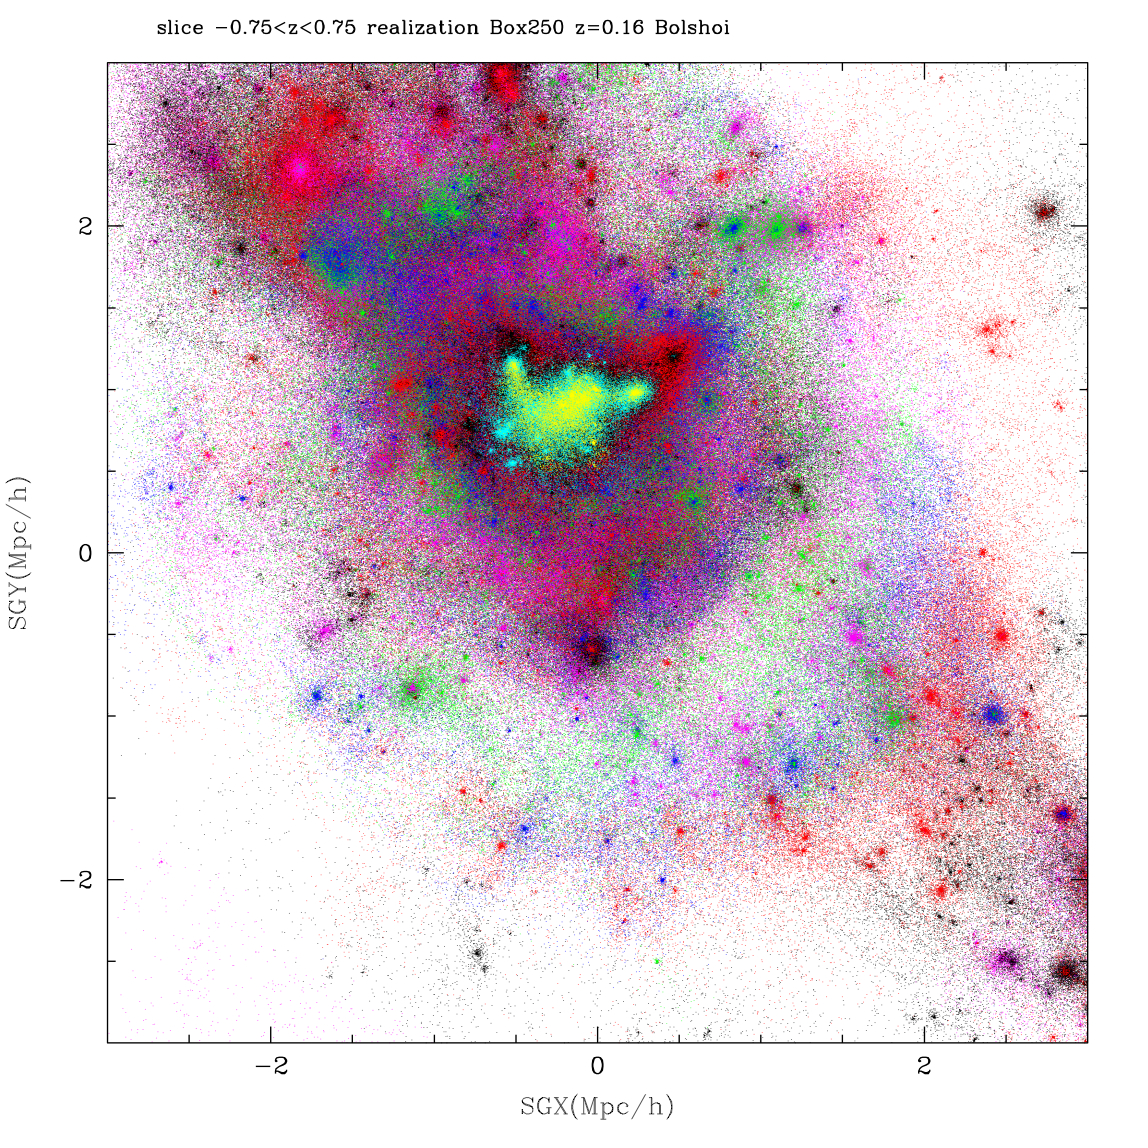
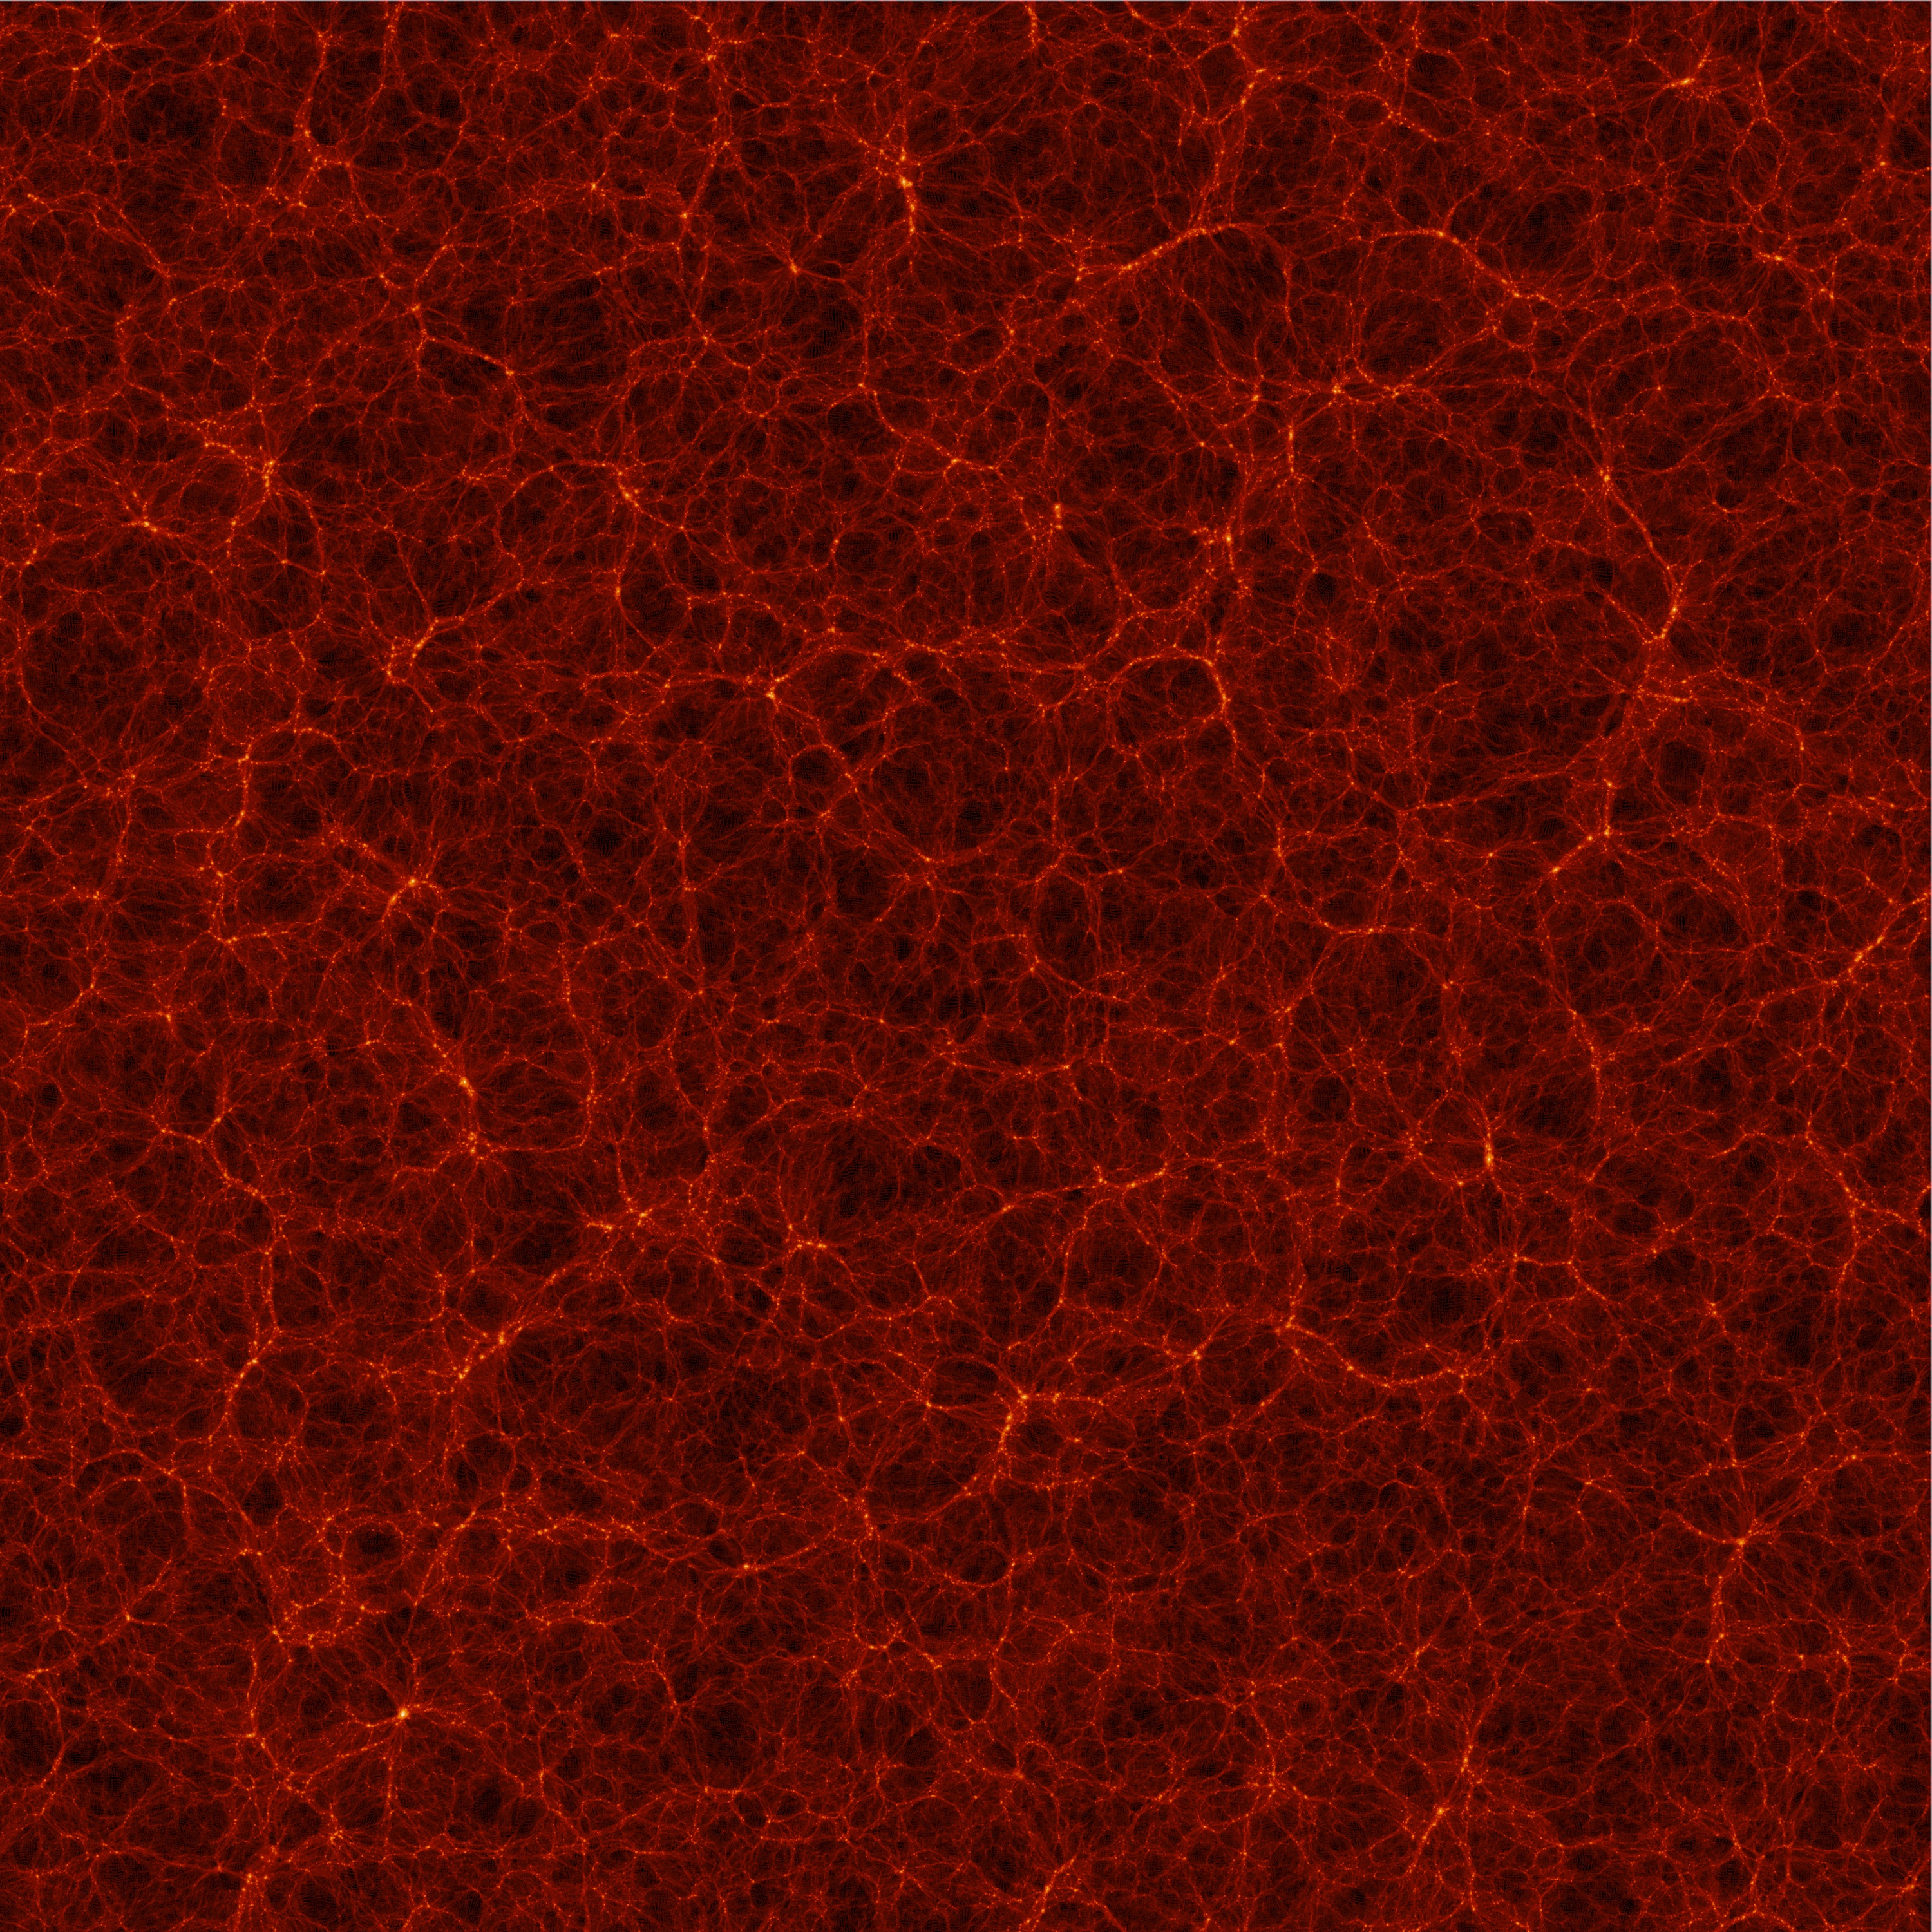
A high resolution slice of the whole 250Mpc box of Bolshoi. Made by Stefan Gottlober (AIP) with IDL
slicex jpg [3000 x 3000, 3 MB]
slicex png [3000x3000, 14.9 MB]
slicex eps [5.7 MB]
The following images & descriptions are taken from the http://bolshoi.aip.de/
A slice of the whole 250Mpc box of Bolshoi. Made by Stefan Gottlober (AIP) with IDL
10Mpc slice at z=0 of the whole box. Shown is the
maximum of density along the line of sight.
10Mpc slice at z=0 of the whole box. Shown is the maximum of density along the line of sight.
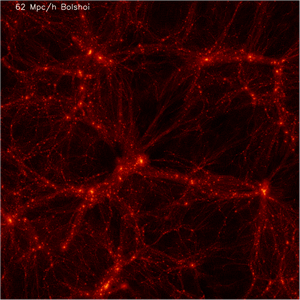
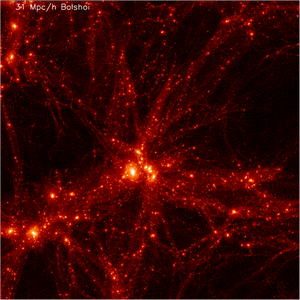
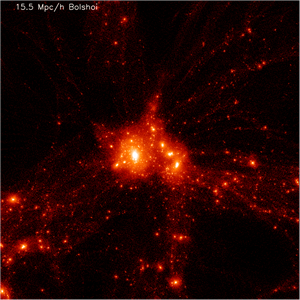
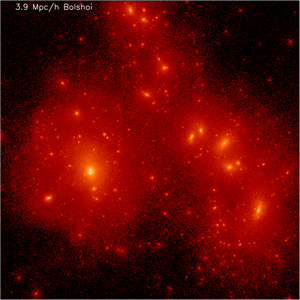
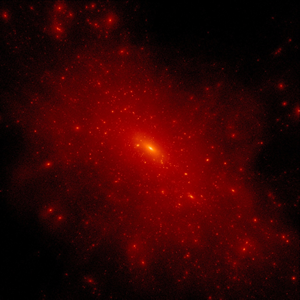
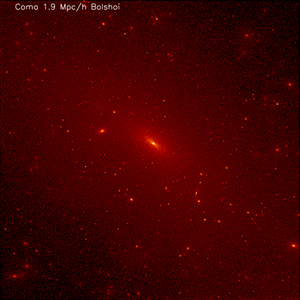
Zoom-in
Begining with a 62 Mpc/h box
ps [4.9 MB]
png[2359x2359, 8.2 MB]
31 Mpc/h
15.5 Mpc/h
3.9 Mpc/h
7.7 Mpc/h
1.9 Mpc/h


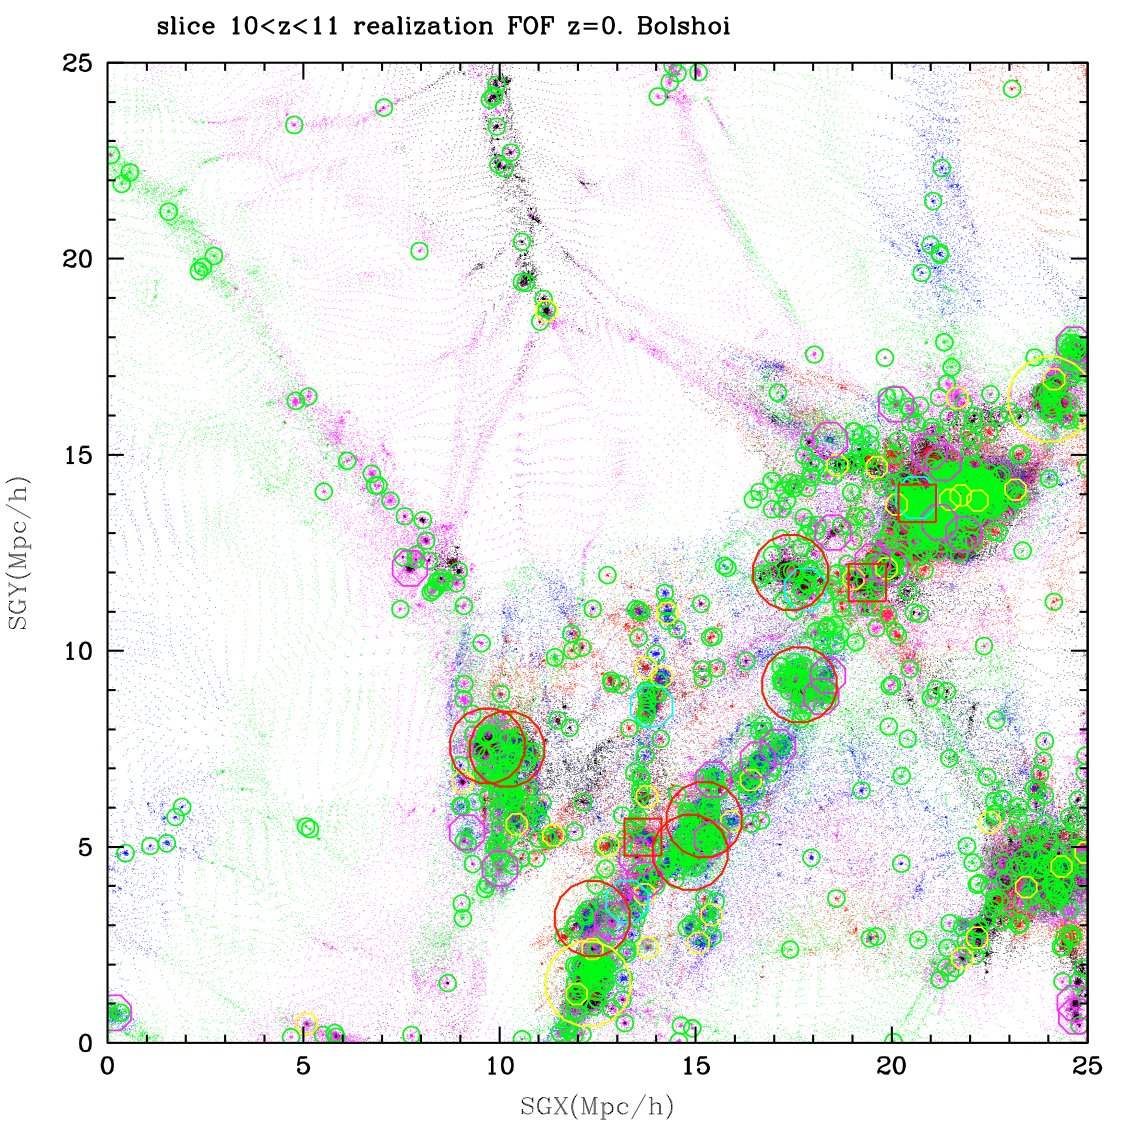
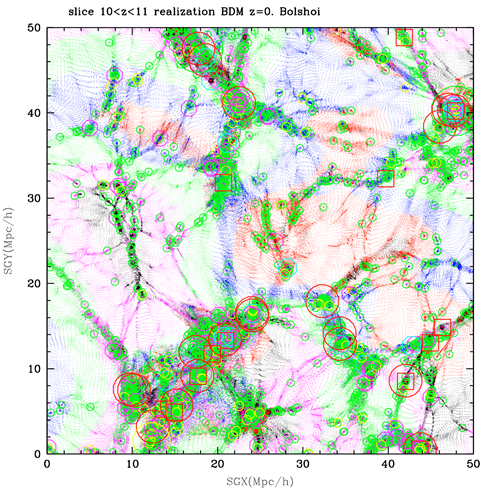
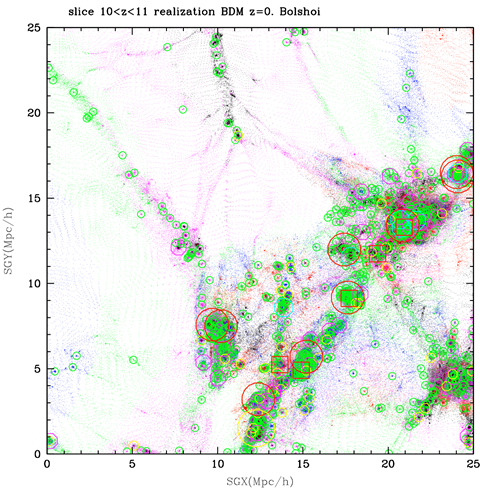
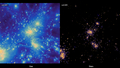
The same region with halos identified with Friends-of-Friends algorithm (Gottloeber, AIP). Compare this and previous plot. FOF finds more of very small halos. Overall, there is good correspondence between the codes for distinct halos.
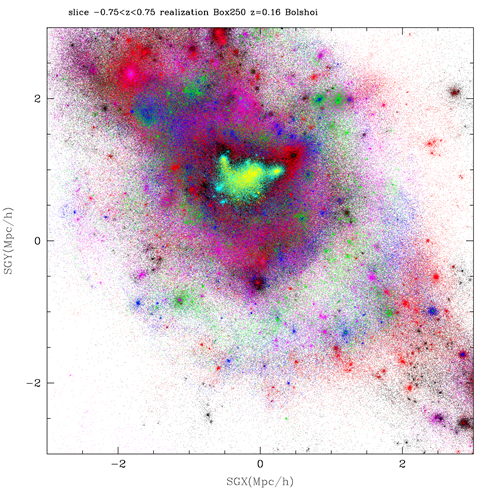
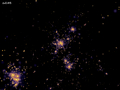
Dark matter particles in a slice. Particles colored by their velocity.
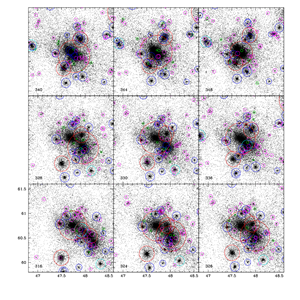
Numbers in the left-bottom corners of each panel show time-step for the snapshot with the latest moment 348 corresponding to a =0.796 (z =0.25). During the merging of two largest halos (middle section, snapshots 328-336) the halo finder may either miss one of the halos (snpshot 328) or underestimate its mass (snapshot 330)
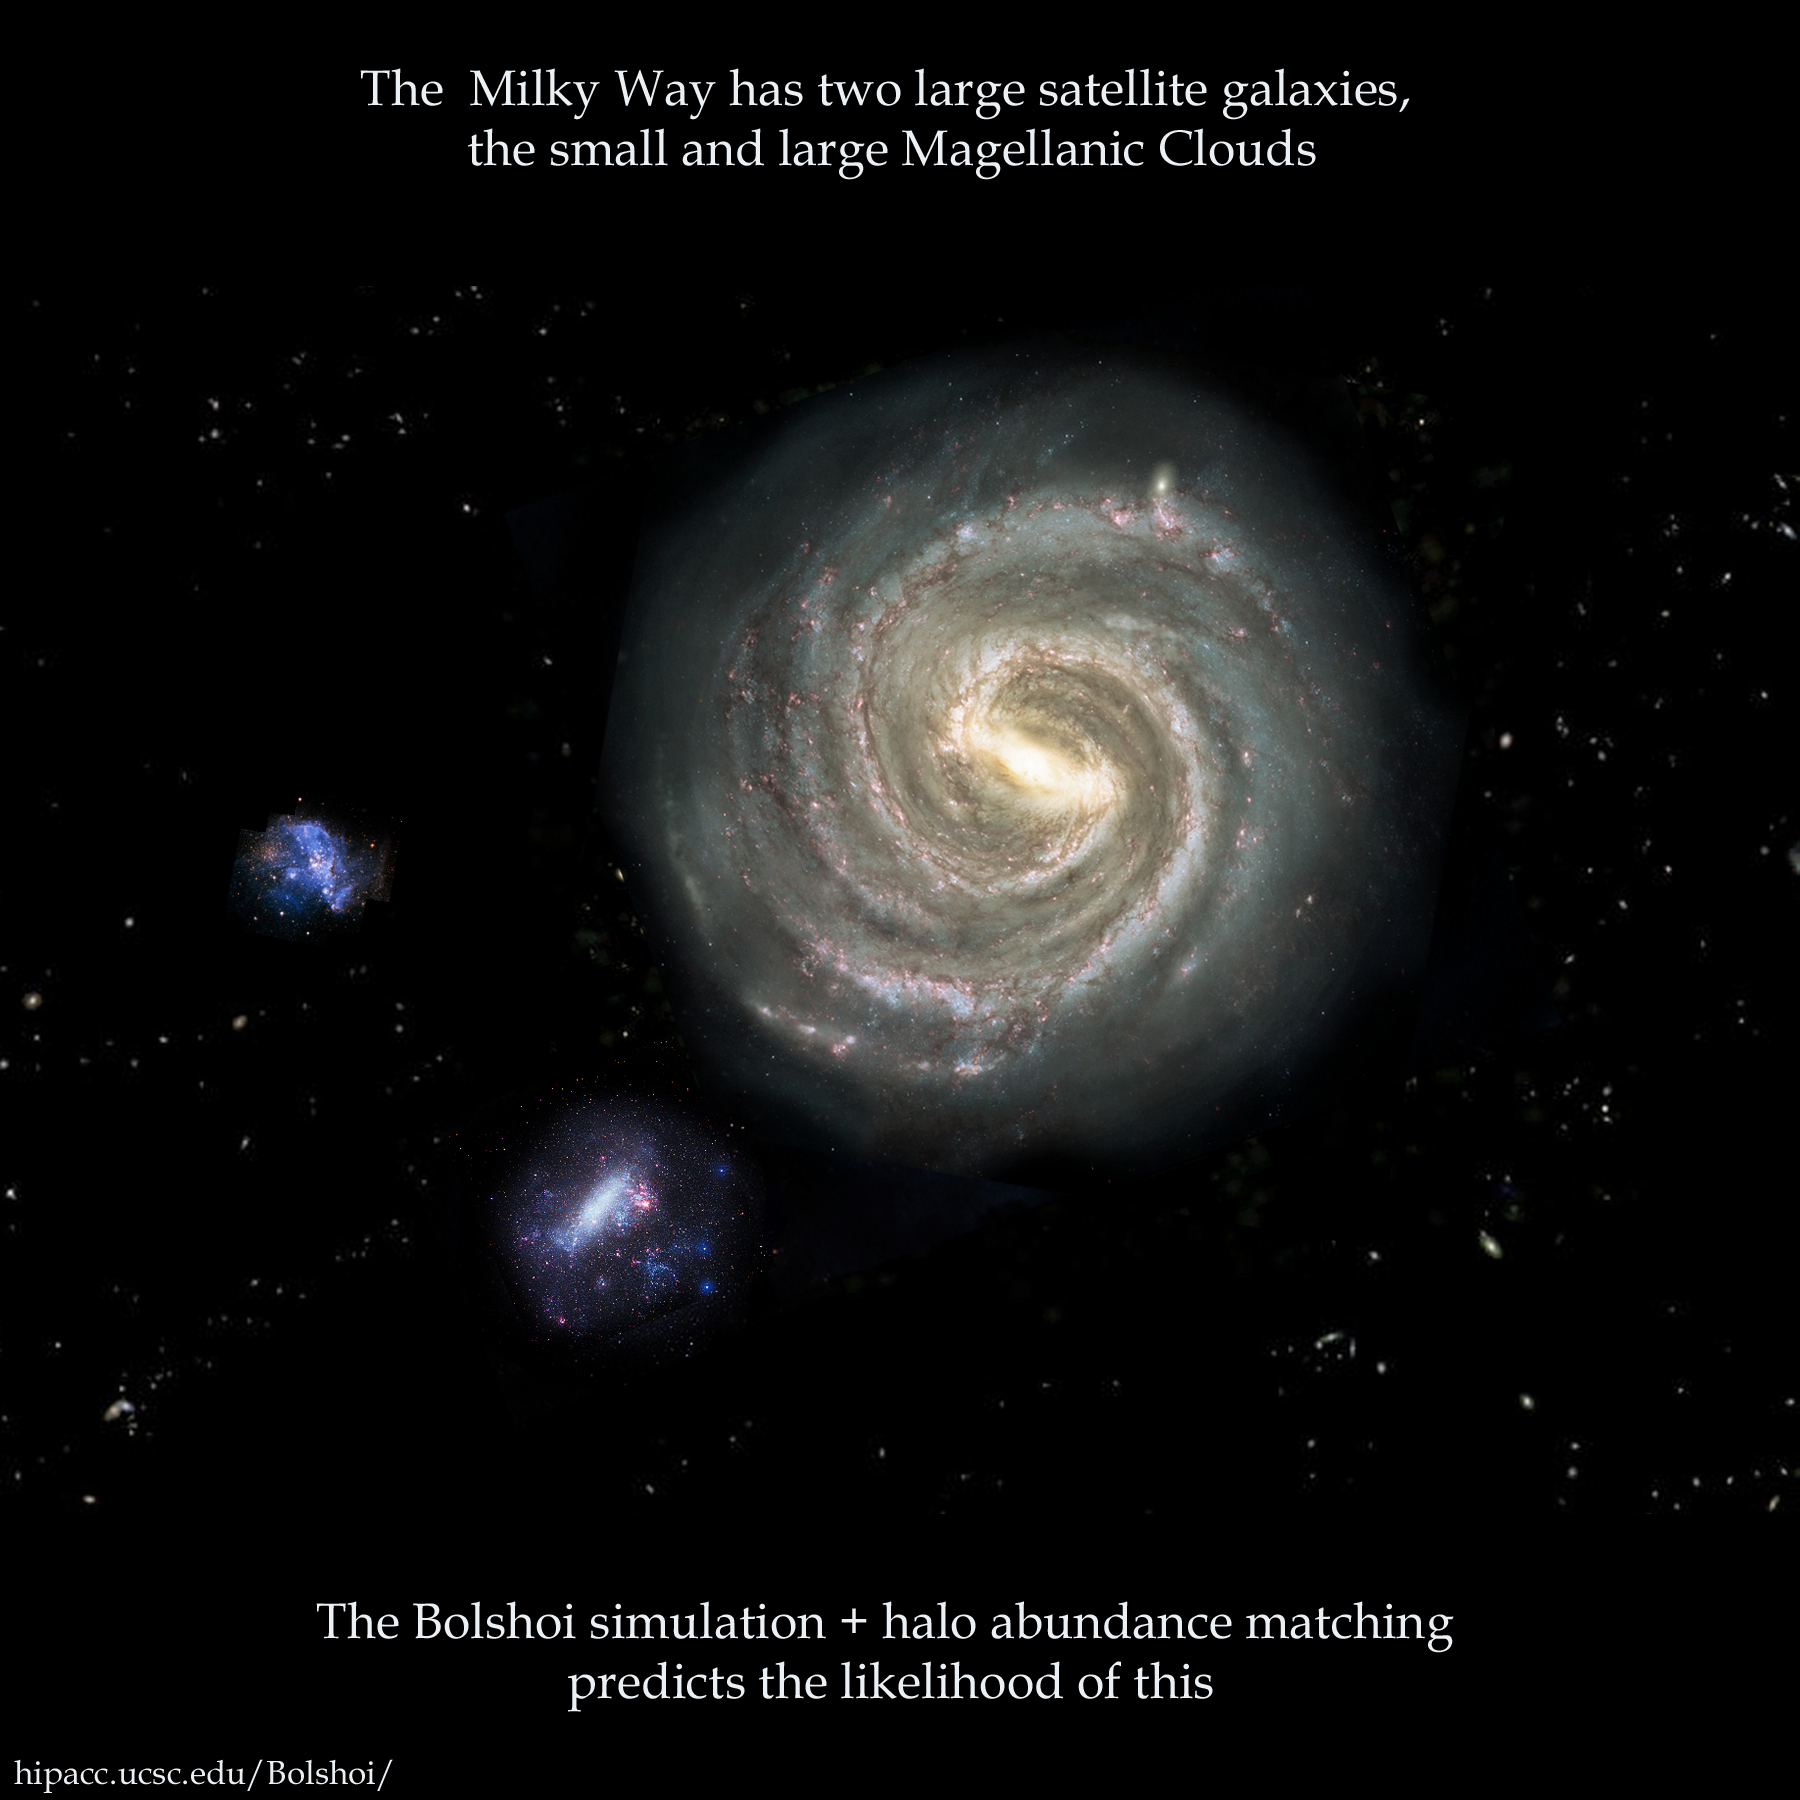
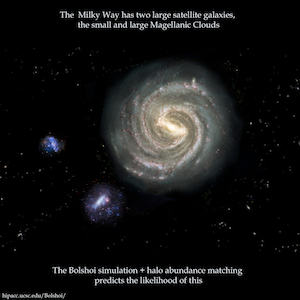
Credit line: collage by Nina McCurdy, including Nick
Risinger's "Artist's conception of the Milky Way galaxy"
(25 June 2009) [source wikipedia ], adapted from the
NASA illustration ) and the NASA images of the Large
and Small Magellanic Clouds.
jpg [1800x1800, 1.1 MB]
The following three slides (modified) were taken from a talk given by Joel Primack at the 2011 Galaxy Formation conference in Durham, UK.
click here to view the talk
click here to view the conference website
A similar talk was given by Joel Primack at the 2011 Santa Cruz Galaxy Workshop
click here to view the talk
click here to view the conference website
click here to watch a recording of this talk
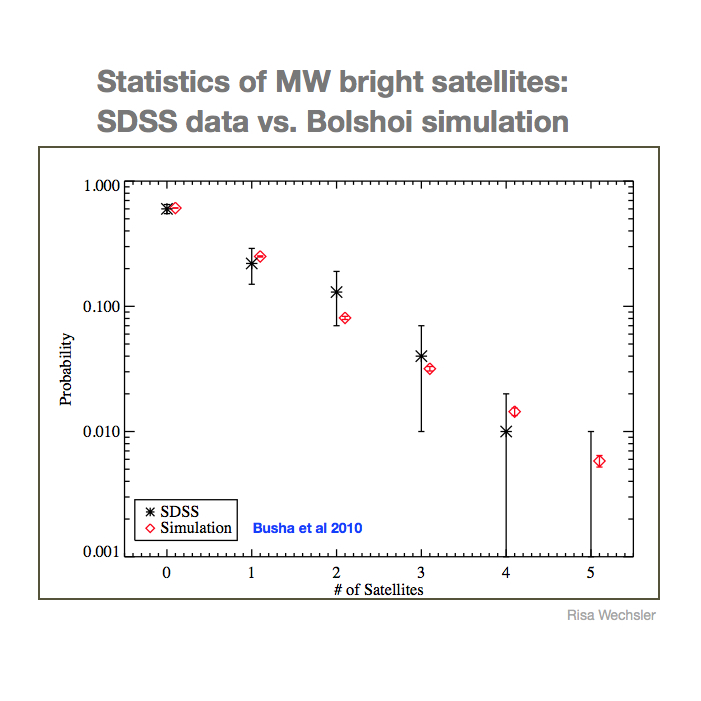
Comparison of Bolshoi with SDSS observations is in close
agreement, well within observed statistical error bars.
Credit: Risa Wechsler (Stanford)
Statistics of Milky Way bright satellites: SDSS vs. Bolshoi Simulation.
This is duscussed in great detail in paper 4

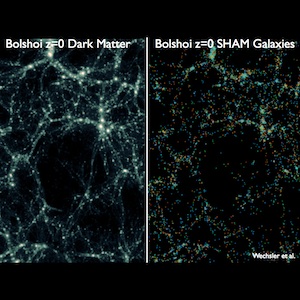
A Visual comparison of Bolshoi dark matter halos and Bolshoi SHAM galaxies at Z=0

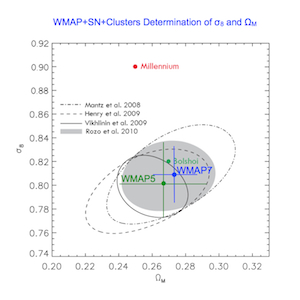
The Bolshoi Simulation (green dot) is in extrememly good agreement with all recent determinations of cosmological parameters, sigma8 and OmegaM, while the millenium simulation (red dot) is far from these parameters.
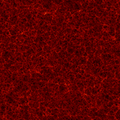
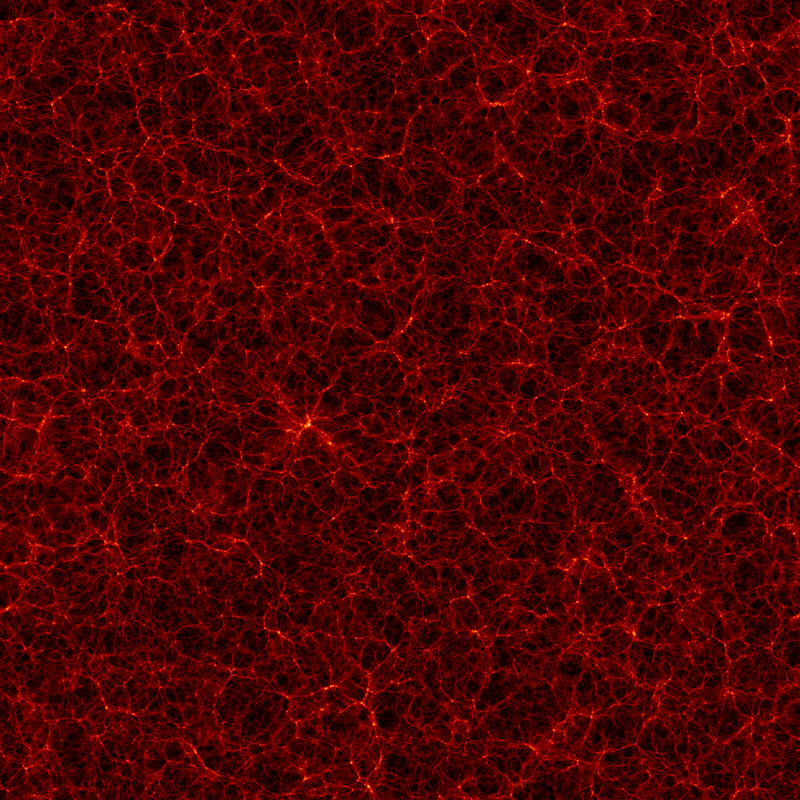
A high resolution slice of the whole 1000Mpc box of BigBolshoi. Made by Stefan Gottlober (AIP) with IDL
slicex jpg [3000 x 3000, 3.9 MB]
slicex png [3000x3000, 16.9 MB]
slicex eps [5.7 MB]
slicey jpg [3000 x 3000, 3.9 MB]
slicey png [3000x3000, 16.9 MB]
slicey eps [5.7 MB]
slicez jpg [3000 x 3000, 3.2 MB]
slicez png [3000x3000, 17 MB]
slicez eps [5.7 MB]
The following images & descriptions are taken from the MultiDark Database website

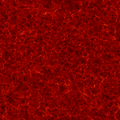
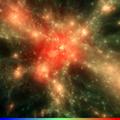
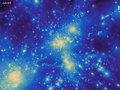
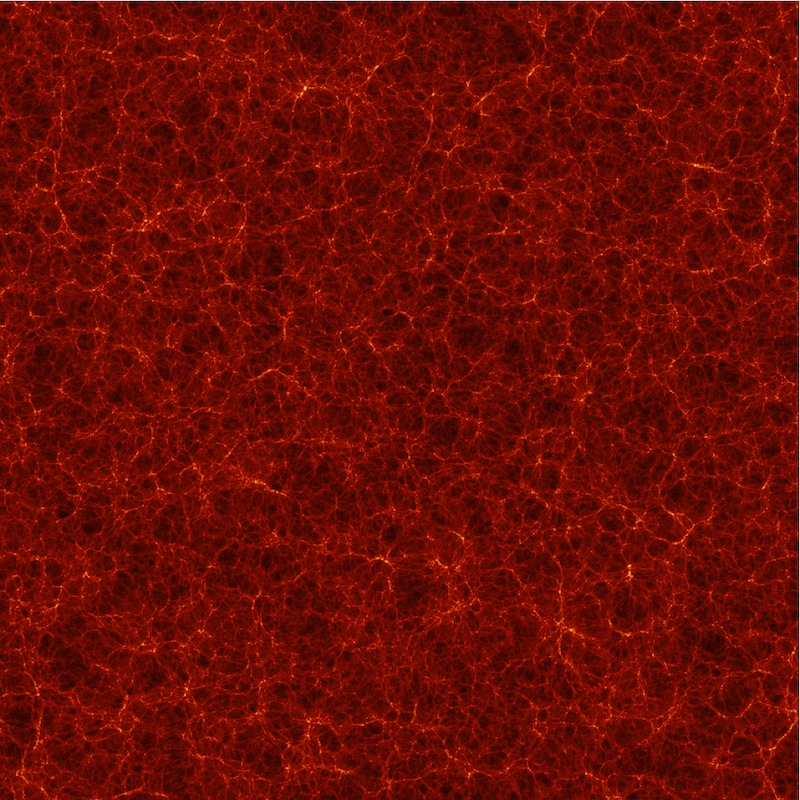
Slice through the MultiDark simulation at redshift z = 0.53 (snapshot 62), different projections showing the density distribution. The slice is 5 Mpc/h thick, the side length is 1 Gpc/h (full box). (Stefan Gottlöber, IDL)
x-y projection [eps, 650 KB]
x-y projection [png, 800x800, 1.9 MB]
y-z projection [eps, 650 KB]
y-z projection [png, 800x800, 1.8 MB]
z-x projection [eps, 650 KB]
z-x projection [png, 800x800, 1.9 MB]
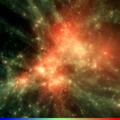
Again a slice for redshift z = 0.53, but the slice is 10 Mpc/h thick. (Stefan Gottlöber, IDL)
x-y projection [eps, 650 KB]
x-y projection [png, 800x800, 2.0 MB]
y-z projection [eps, 650 KB]
y-z projection [png, 800x800, 1.9 MB]
z-x distribution, centered on the most massive cluster:
z-x projection [eps, 650 KB]
z-x projection [png, 800x800, 2.0 MB]
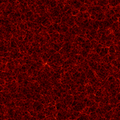
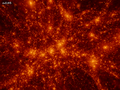
Slice through the MultiDark simulation at redshift z = 0 (snapshot 84), projected along the x-direction to view the y-z density distribution. The slice is again 5 Mpc/h thick. (Stefan Gottlöber, IDL)
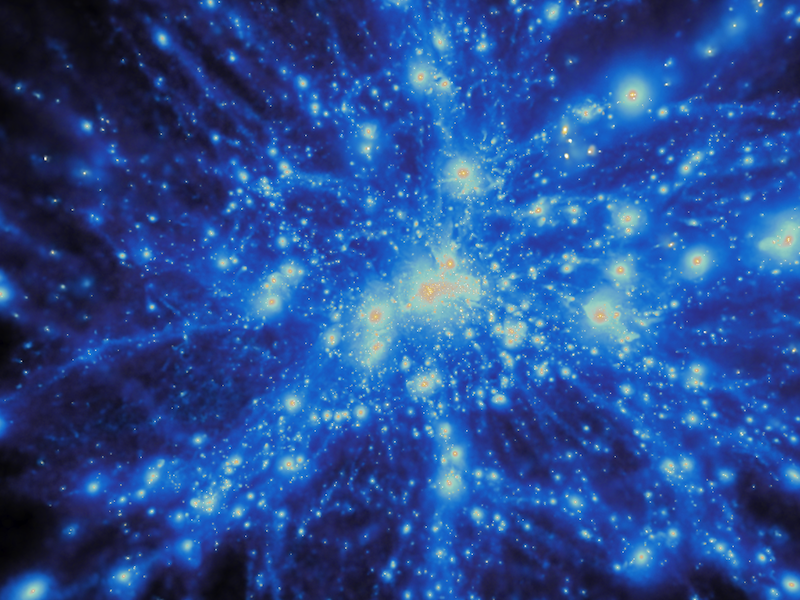
Gas density distribution of the most massive galaxy cluster (cluster 001) in a high resolution resimulation, x-y-projection. (Kristin Riebe, PMviewer)
high resolution png [1024x768, 1.9 MB]
small resolution png [480x360, 880 KB]
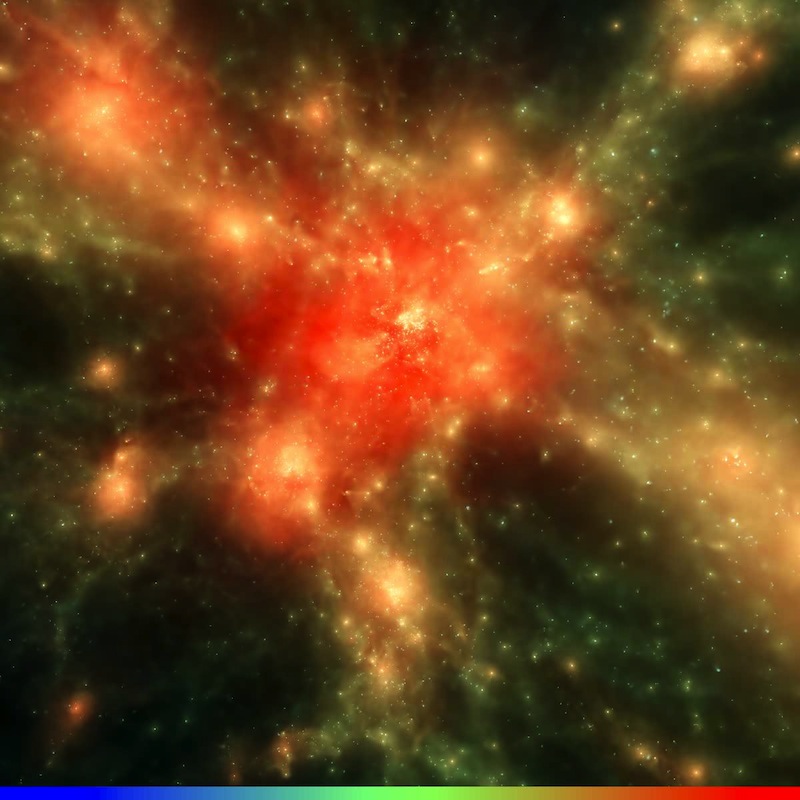
Evolution of the gas density in the high resolution resimulation of cluster 001. (Gustavo Yepes, Splotch).

Evolution of the gas density in the resimulated cluster 007. (Gustavo Yepes, Splotch).
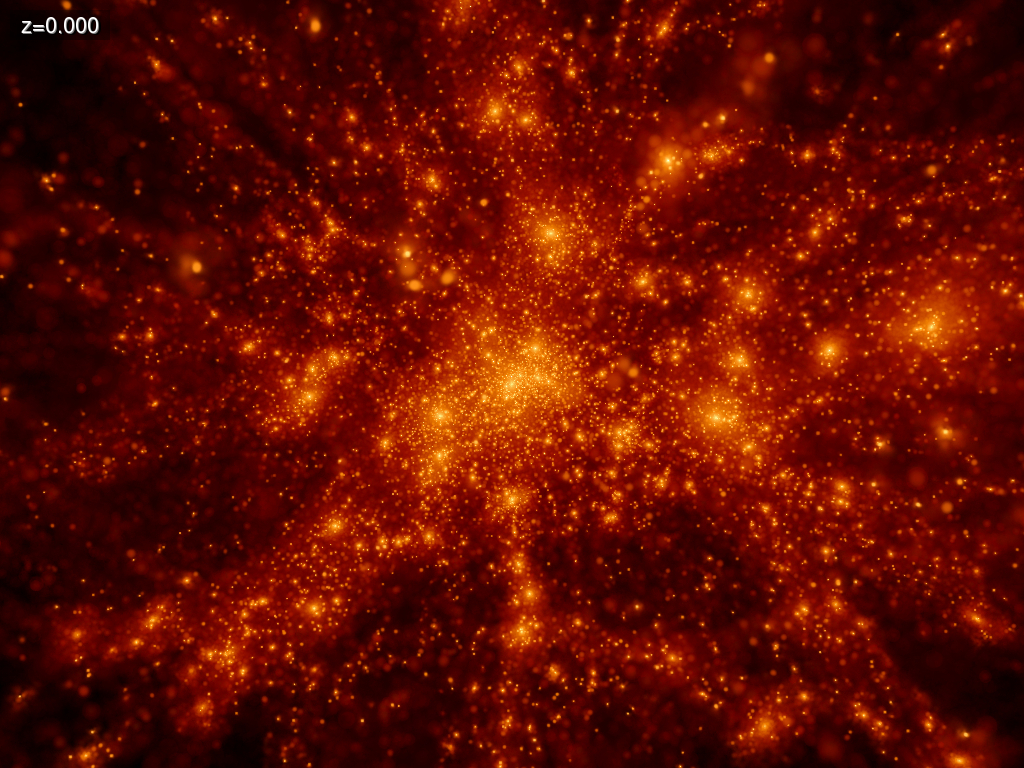
Evolution of the dark matter density of the resimulated cluster 001, from z=1.222 to today. The region was centered on the most massive halo at redshift 0. (K. Riebe; PMViewer).
avi [1280x720, 9.1 MB]
jpg [1280x720, 1.1 MB]
jpg with scale [1280x720, 1.1 MB]

Evolution of the dark matter density of the resimulated cluster 001, centered on the most massive halo at redshift 0, zoomed further inwards (factor 3). (K. Riebe; PMViewer).
avi [1024x768, 8.7 MB]
jpg [1024x768, 903 KB]
jpg with scale [1024x768, 917 KB]

Evolution of the gas density of the resimulated cluster 001, same center and region as for corresponding dark matter movie. (K. Riebe; PMViewer).
avi [1024x768, 8.7 MB]
jpg [1024x768, 874 KB]
jpg with scale [1024x768, 889 KB]
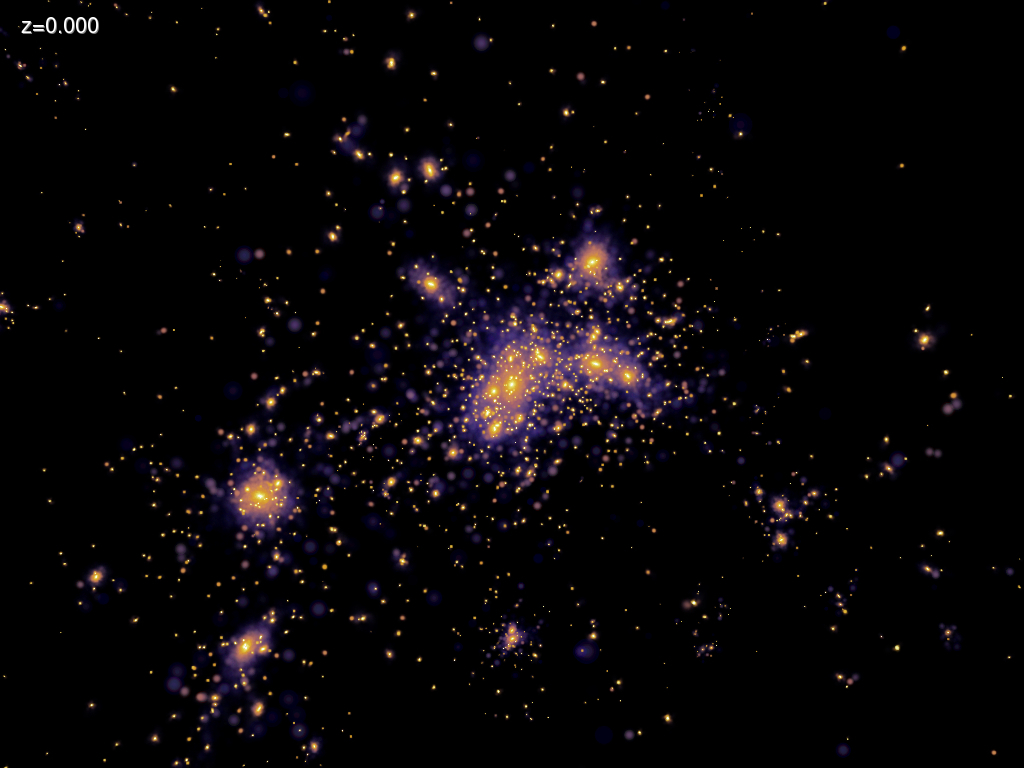
Evolution of the stellar density of the resimulated cluster 001, same center and region as for corresponding dark matter and gas movie above. (K. Riebe; PMViewer).
avi [1200x1200, 23 MB]
jpg [1200x1200, 61 KB]
jpg with scale [1024x768, 406 KB]
![slicex png [3000x3000, 14.9 MB]](images/Images/Bolshoi_high-res.png)
![jpg [2362 x 2360, 1.7 MB]](images/Images/BolshoiZ.jpg)
![png [2362x2360, 9.1 MB]](images/Images/BolshoiZ.png)
![png [1132x1134, 3.5 MB]](images/Images/Bolshoi250Mpch.png)
![jpg [1132x1134, 1.1 MB]](images/Images/Bolshoi_Purple.jpg)
![png[2359x2359, 8.2 MB]](images/Images/dens2.62.png)
![slicex png [3000x3000, 16.9 MB]](images/Images/BigBolshoislicex_high_res.png)
![slicey jpg [3000 x 3000, 3.9 MB]](images/Images/BigBolshoislicey_3000.jpg)
![slicey png [3000x3000, 16.9 MB]](images/Images/BigBolshoislicey_high_res.png)
![slicez png [3000x3000, 17 MB]](images/Images/BigBolshoislicey_3000.png)
![x-y projection [png, 800x800, 1.9 MB]](http://www.multidark.org/MultiDark/images/slice_0062_05xy.png)
![y-z projection [png, 800x800, 1.8 MB]](http://www.multidark.org/MultiDark/images/slice_0062_05yz.png)
![z-x projection [png, 800x800, 1.9 MB]](http://www.multidark.org/MultiDark/images/slice_0062_05zx.png)
![x-y projection [png, 800x800, 2.0 MB]](http://www.multidark.org/MultiDark/images/slice_0062_10xy.png)
![y-z projection [png, 800x800, 1.9 MB]](http://www.multidark.org/MultiDark/images/slice_0062_10yz.png)
![z-x projection [png, 800x800, 2.0 MB]](http://www.multidark.org/MultiDark/images/slice_0062_10zx.png)
![png [800x800, 1.8 MB]](http://www.multidark.org/MultiDark/images/slice_0084_5yz.png)
![high resolution png [1024x768, 1.9 MB]](http://www.multidark.org/MultiDark/images/MD_cluster01_gas_sn320.png)
![small resolution png [480x360, 880 KB]](http://www.multidark.org/MultiDark/images/MD_cluster01_gas_sn320-s.png)
![jpg [1200x1200, 84 KB]](http://www.multidark.org/MultiDark/images/gascenter_clus01.jpg)
![jpg [1200x1200, 79 KB]](http://www.multidark.org/MultiDark/images/gascenter_clus007.jpg)
![jpg [1280x720, 1.1 MB]](http://www.multidark.org/MultiDark/images/MDR1_cl01_dm_evol_snap_320.jpg)
![jpg with scale [1280x720, 1.1 MB]](http://www.multidark.org/MultiDark/images/MDR1_cl01_dm_evol_snap_320-scale.jpg)
![jpg [1024x768, 903 KB]](images/Images/MDR1_cl01_dm_evol_zoom_snap_320.jpg)
![jpg with scale [1024x768, 917 KB]](http://www.multidark.org/MultiDark/images/MDR1_cl01_dm_evol_zoom_snap_320-scale.jpg)
![jpg [1024x768, 874 KB]](images/Images/MDR1_cl01_gas_evol_zoom_snap_320.jpg)
![jpg with scale [1024x768, 889 KB]](http://www.multidark.org/MultiDark/images/MDR1_cl01_gas_evol_zoom_snap_320-scale.jpg)
![jpg with scale [1024x768, 406 KB]](images/Images/MDR1_cl01_stars_evol_zoom_snap_320-scale.jpg)
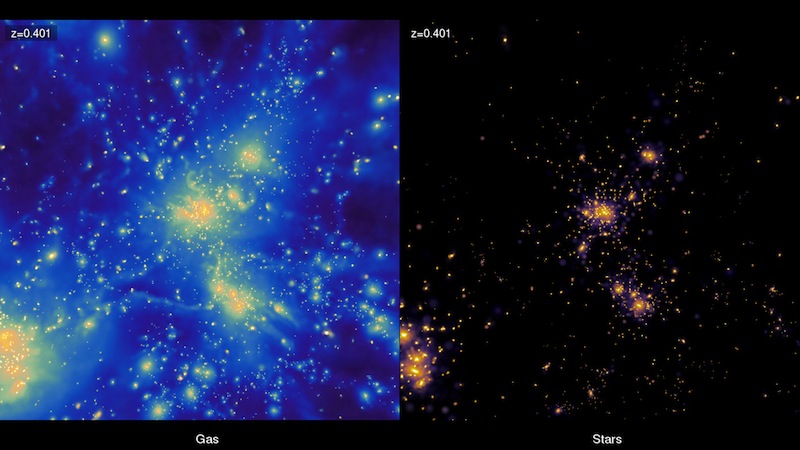
Evolution of the gas (left) and stellar (right panel) density of the resimulated cluster 001, same center and region as for corresponding dark matter and gas movie above. (K. Riebe; PMViewer).
avi [1024x768, 8.7 MB]
jpg [1024x768, 829 KB]
jpg with scale [1024x768, 832 KB]
![jpg [1024x768, 829 KB]](http://www.multidark.org/MultiDark/images/MDR1_cl01_evol_zoom_combine_gas_stars.jpg)
![jpg with scale [1024x768, 832 KB]](http://www.multidark.org/MultiDark/images/MDR1_cl01_evol_zoom_combine_gas_stars_snap_320-scale.jpg)